Vitamin D
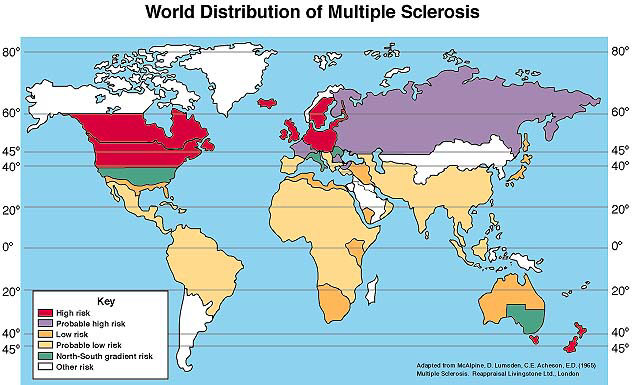
This graph demonstrates the risk of getting Multiple Sclerosis depending on latitude. As the graph demonstrates, most of the highest risk factors are farther away from the equator in which signifies it may have a relation to Vitamin D intake. Vitamin D is usually absorbed through UV rays by the sun. There is also a correlation between races shown. The highest risks are located in North America (US and Canada) and Europe, and a few islands off of Australia. Most of these places just listed are inhabited by White people, in which may signify Multiple Sclerosis may happen to white descent people rather than other races/ethnicities. On the bottom graph, it gives a closer look on the percentage of vitamin D defiecny by country. As shown, the farther you are from. The equator the higher the percentage. This graphs also shows the correlation between vitamin D and Multiple sclerosis.
John W.Rose, M.D., Maria Houtchens, MSIII, Sharon G. Lynch, M.D. (N/A). Multiple Sclerosis: Lectures: Epidemiology and Prevalence. Retrieved from. http://library.med.utah.edu/kw/ms/epidemiology.html
http://library.med.utah.edu/kw/ms/mml/ms_worldmap.html
http://library.med.utah.edu/kw/ms/mml/ms_worldmap.html
Gender
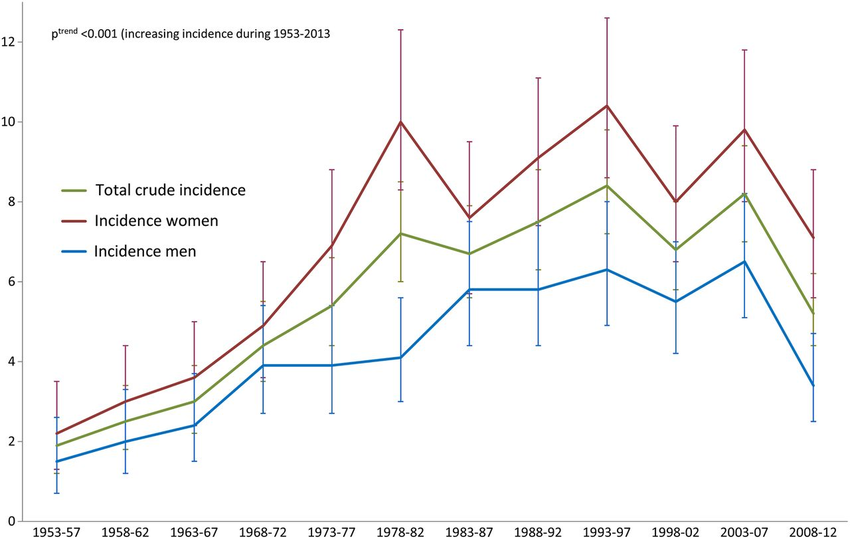
This graph demonstrates the prevalence between males and females during 1993-2013. This graph was taken out of 100,000 people as samples at 5-year periods. As shown, females have been extremely mor e prevalent than males, in which can explain the statistic how women are 2.5 more likely to have MS.
Research gate. (February, 2015). Incidence and Prevalance of Multiple Sclerosis. Retrieved from. https://www.researchgate.net/figure/272839045_fig3_Figure1-Time-delay-from-onset-of-disease-until-diagnosis-of-multiple-sclerosis-in
